Original Image
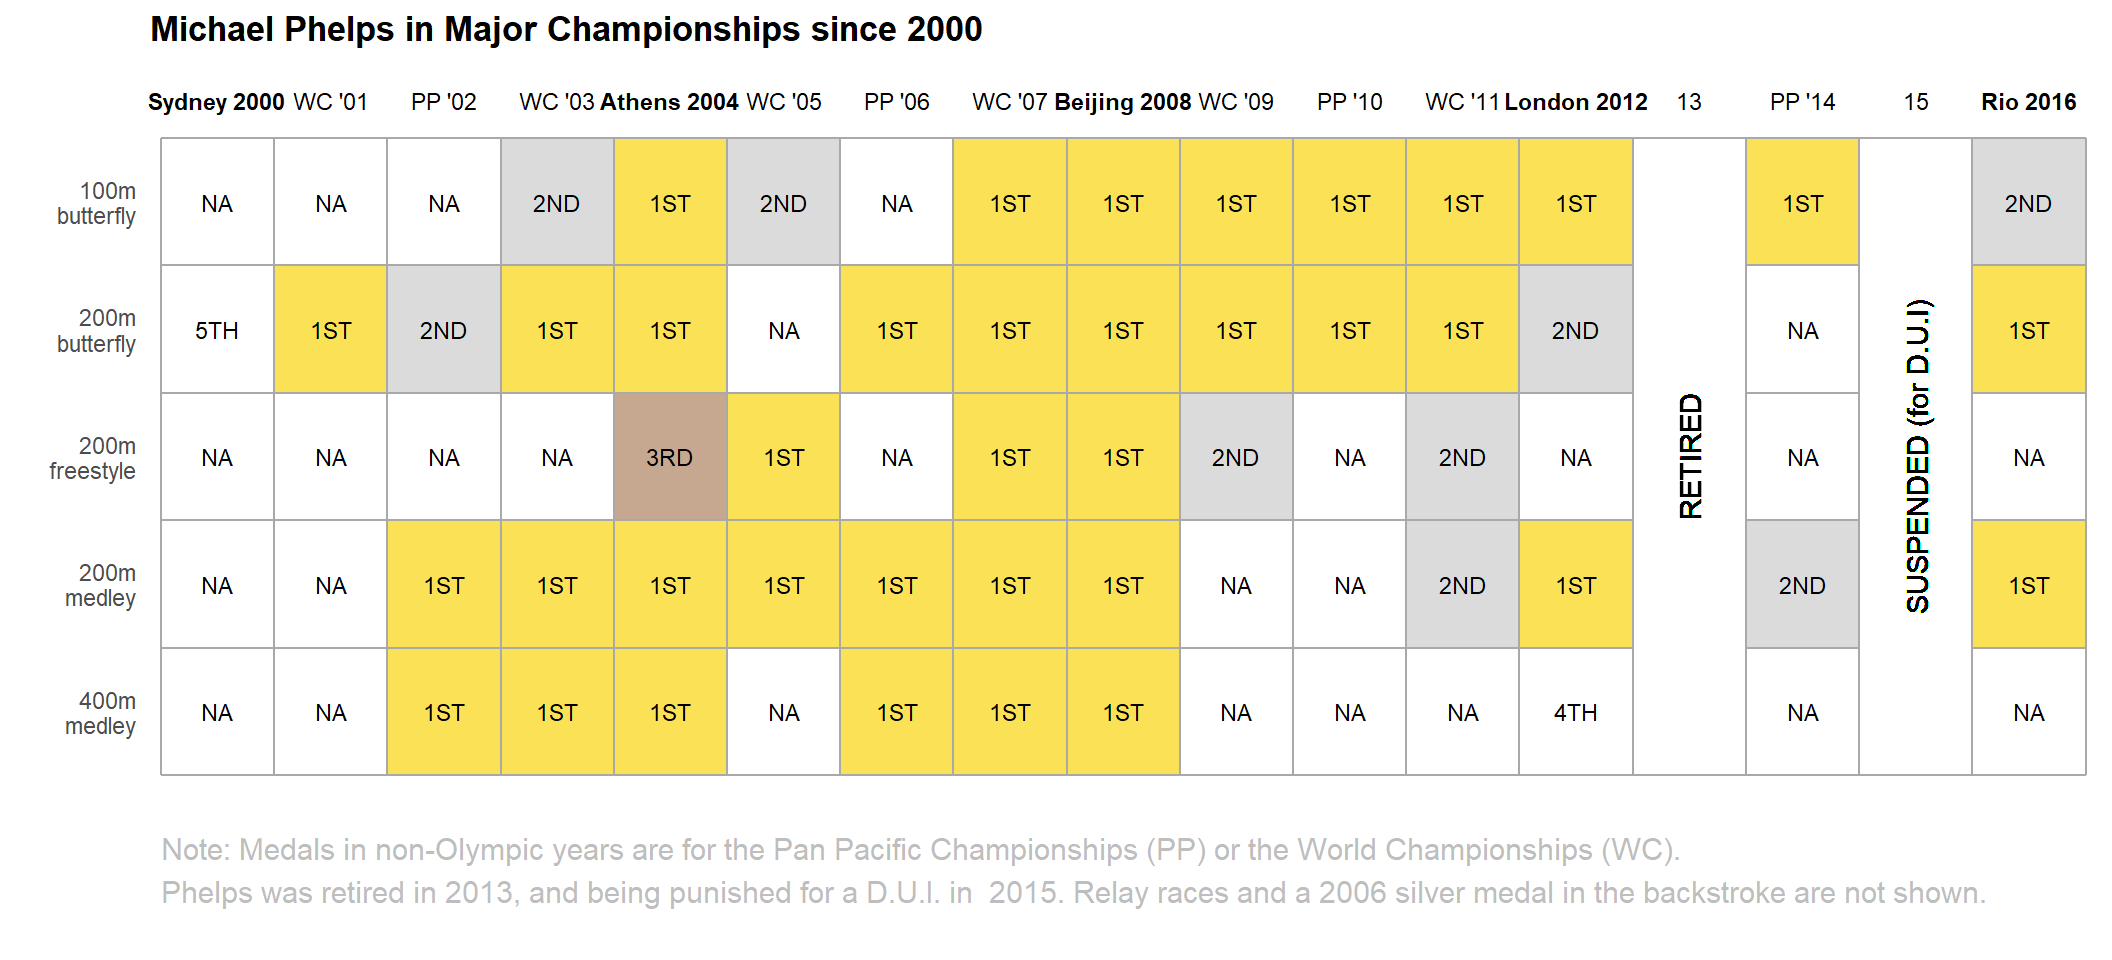
The image below was published in New York Times. https://www.nytimes.com/interactive/2016/08/09/sports/olympics/2016-08-09-olympics-phelps-vs-phelps.html
Data Preparation
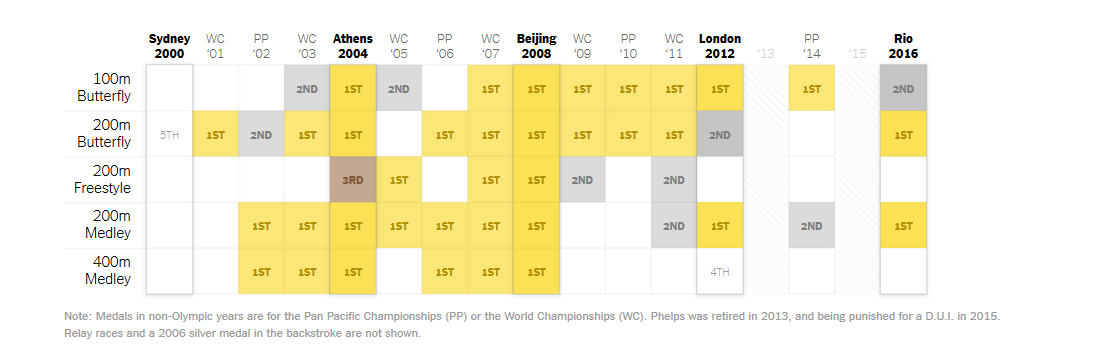
Below is the accompanying code to reproduce the chart above. The data was manually created by studying the chart.
library(dplyr)
library(tidyr)
library(ggplot2)
library(grid)
library(gridExtra)

phelps_medals <- readxl::read_excel("./data/phelps_medals.xlsx")
phelps_medals$Event_Type <- factor(phelps_medals$Event_Type, levels = rev(phelps_medals$Event_Type %>% unique()))
phelps_medals$Competetion_Name <- factor(phelps_medals$Competetion_Name, levels = phelps_medals$Competetion_Name %>% unique())
GGPLOT2
p <- ggplot(phelps_medals, aes(x=Competetion_Name,y=Event_Type)) +
  geom_tile(aes(fill=Result)) +
  theme_bw() +
  scale_fill_manual(values=c("#FAE155","#DBDBDB","#C6A891","#FFFFFF","#FFFFFF","#FFFFFF","#FFFFFF","#FFFFFF")) +
  theme(
    panel.grid.minor.x = element_blank(),
    panel.grid.major.x = element_blank(),
    panel.grid.minor.y = element_blank(),
    panel.grid.major.y= element_blank(),
    legend.position="none",
    axis.text.x = element_blank(),
    axis.ticks.x = element_blank(),
    axis.ticks.y = element_blank(),
    panel.border = element_blank(),
    plot.title = element_text(hjust=0,face="bold")
  ) +
  xlab("") + ylab("") +
  geom_text(
    aes(
      x = Competetion_Name , y = Event_Type ,
      label = ifelse(Result %in% c("RETIRED","SUSPENDED"),"",Result)
    ),size =3
  ) +
  geom_segment(data = data.frame(x1=rep(0.5,4),x2=rep(13.5,4),y1=seq(1.5,4.5,1),y2=seq(1.5,4.5,1)),aes(x = x1, y = y1, xend = x2, yend = y2),size=0.5,color="dark grey") +
  geom_segment(data = data.frame(x1=rep(14.5,4),x2=rep(15.5,4),y1=seq(1.5,4.5,1),y2=seq(1.5,4.5,1)),aes(x = x1, y = y1, xend = x2, yend = y2),size=0.5,color="dark grey") +
  geom_segment(data = data.frame(x1=rep(16.5,4),x2=rep(17.5,4),y1=seq(1.5,4.5,1),y2=seq(1.5,4.5,1)),aes(x = x1, y = y1, xend = x2, yend = y2),size=0.5,color="dark grey") +
  geom_segment(data = data.frame(x1=rep(0.5,2),x2=rep(17.5,2),y1=c(0.5,5.5),y2=c(0.5,5.5)),aes(x = x1, y = y1, xend = x2, yend = y2),size=0.5,color="dark grey") +
  geom_segment(data = data.frame(x1=seq(0.5,17.5,1),x2=seq(0.5,17.5,1),y1=rep(0.5,18),y2=rep(5.5,18)),aes(x = x1, y = y1, xend = x2, yend = y2),size=0.5,color="dark grey") +
  annotate("text", label = "Note: Medals in non-Olympic years are for the Pan Pacific Championships (PP) or the World Championships (WC).\nPhelps was retired in 2013, and being punished for a D.U.I. in  2015. Relay races and a 2006 silver medal in the backstroke are not shown.", x = 0.5, y = -0.5, size = 4, colour = "grey",hjust = 0,vjust=0) +
  geom_text(
    aes(x=X,y=Y,label=label),
    data=data.frame(
      X=seq(1,17,1),Y=5.8,label=as.character(unique(phelps_medals$Competetion_Name))
    ),
    size = 3,
    fontface = ifelse(as.character(unique(phelps_medals$Competetion_Name)) %in% c("Sydney 2000","Athens 2004","Beijing 2008","London 2012","Rio 2016"),"bold","plain")
  ) +
  ggtitle("Michael Phelps in Major Championships since 2000\n") +
  geom_text(x=14,y = 3,label="RETIRED",angle=90) +
  geom_text(x=16,y = 3,label="SUSPENDED (for D.U.I)",angle=90) +
  scale_y_discrete(
    labels=c(
      "100m butterfly" = "100m\nbutterfly",
      "200m butterfly" = "200m\nbutterfly",
      "200m freestyle" = "200m\nfreestyle",
      "200m medley" = "200m\nmedley",
      "400m medley" = "400m\nmedley")
  )

# turnoff text clipping
gt <- ggplot_gtable(ggplot_build(p))
gt$layout$clip[gt$layout$name == "panel"] <- "off"
grid.draw(gt)