Original Image
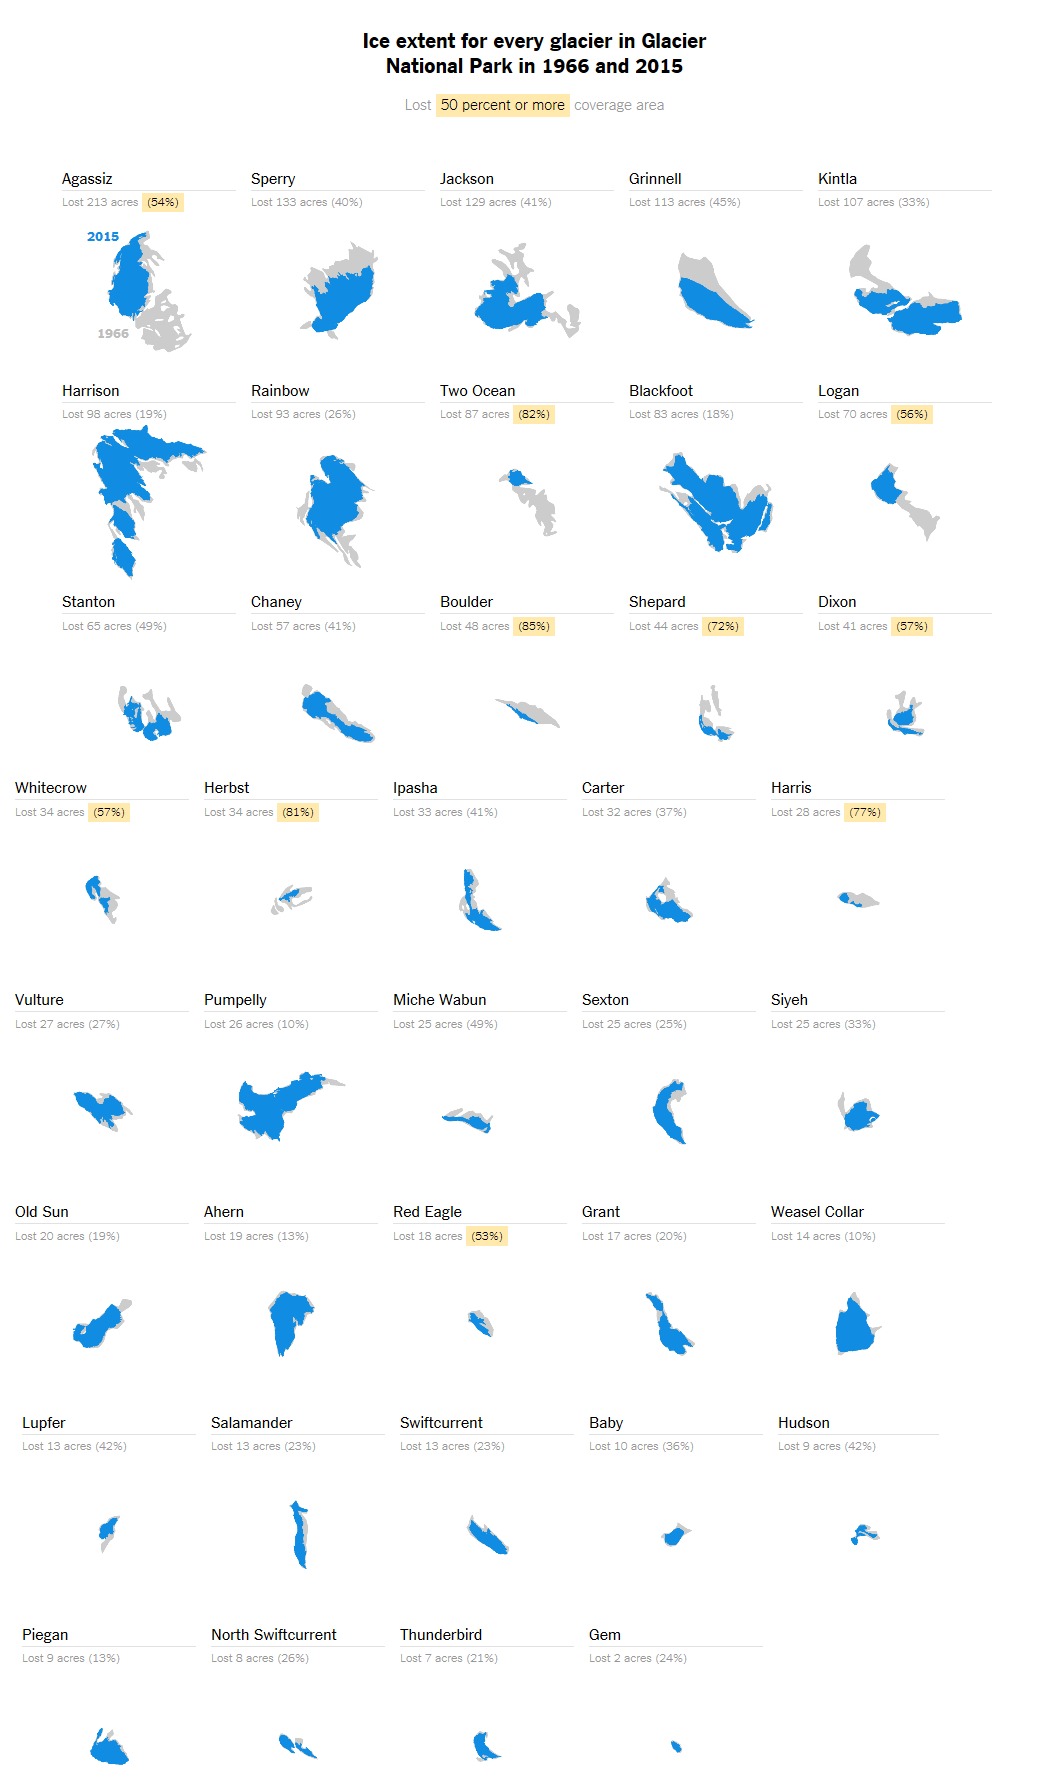
The image below was published in New York Times. https://www.nytimes.com/interactive/2017/05/24/climate/mapping-50-years-of-ice-loss-in-glacier-national-park.html
Data Preparation
Below is the accompanying code to reproduce the chart above. The data was manually created by studying the chart.
library(sf)
library(maptools)
library(rgdal)
library(ggplot2)
library(dplyr)


common <- c("GLACNAME","geometry")

glac_1966 <- sf::st_read('./data/glacier/GNPglaciers_1966.shp') %>% dplyr::select(c(common,"Area1966")) %>% mutate(year = "1966", GLACNAME = as.character(GLACNAME), GLACNAME = ifelse(GLACNAME == 'N. Swiftcurrent Glacier','North Swiftcurrent Glacier', GLACNAME)) %>%
  rename(Area = Area1966)
## Reading layer `GNPglaciers_1966' from data source `C:\Users\saideep\Documents\Git\dataviz-r\content\post\data\glacier\GNPglaciers_1966.shp' using driver `ESRI Shapefile'
## Simple feature collection with 39 features and 13 fields
## geometry type:  MULTIPOLYGON
## dimension:      XY
## bbox:           xmin: 263221.4 ymin: 5355550 xmax: 314490 ymax: 5430612
## epsg (SRID):    26912
## proj4string:    +proj=utm +zone=12 +datum=NAD83 +units=m +no_defs

glac_2015 <- sf::st_read('./data/glacier/GNPglaciers_2015.shp') %>% dplyr::select(c(common,"Area2015")) %>% mutate(year = "2015", GLACNAME = as.character(GLACNAME), GLACNAME = ifelse(GLACNAME == 'Miche Wabun','Miche Wabun Glacier', GLACNAME)) %>%
  rename(Area = Area2015)
## Reading layer `GNPglaciers_2015' from data source `C:\Users\saideep\Documents\Git\dataviz-r\content\post\data\glacier\GNPglaciers_2015.shp' using driver `ESRI Shapefile'
## Simple feature collection with 39 features and 21 fields
## geometry type:  MULTIPOLYGON
## dimension:      XY
## bbox:           xmin: 263261.6 ymin: 5355567 xmax: 314450.7 ymax: 5430538
## epsg (SRID):    26912
## proj4string:    +proj=utm +zone=12 +datum=NAD83 +units=m +no_defs


shrinkage_area <- inner_join(glac_1966 %>% as.data.frame(),
                             glac_2015 %>% as.data.frame(),
                             by = "GLACNAME") %>%
  rename(Area1966 = Area.x, Area2015 = Area.y) %>%
  mutate(percent_change = round((Area1966-Area2015)*100/Area1966),
         area_in_acre = round((Area1966-Area2015)/4046.86)) %>% select(c("GLACNAME","percent_change","area_in_acre","Area1966"))

glac <- rbind(glac_1966, glac_2015)
GGPLOT2
list_plots <- lapply(unique(glac$GLACNAME), function(glacier){

  lost_area <- shrinkage_area %>% filter(GLACNAME == glacier) %>% pull(area_in_acre)
  lost_perc <- shrinkage_area %>% filter(GLACNAME == glacier) %>% pull(percent_change)

  data <- glac %>% filter(GLACNAME == glacier)
  ggplot(data = data) +
    geom_sf(aes(geometry = geometry, fill = year)) +
    theme_void() +
    scale_fill_manual(values = c("#cccccc", "#108ce2")) +
    theme(legend.position = "none",
          plot.title = element_text(size=9,face="bold"),
          plot.subtitle = element_text(size = 7)) +
    labs(title = gsub(pattern = "Glacier", replacement = "",x = glacier),
         subtitle = glue::glue("Lost {lost_area} acres ({lost_perc}%)")) %>%
    return()
})

cowplot::plot_grid(plotlist =  list_plots,ncol = 5)