Data Preparation
Below is the accompanying code to reproduce the chart above. The data is available on the source website.
library(dplyr)
library(ggplot2)
library(ggiraph)

data <- readxl::read_xlsx('./data/happiness/data.xlsx', sheet = 1) %>% janitor::clean_names()

data <- data %>%
  filter(world_happiness_report_score!='-', gdp_per_capita_ppp!='') %>%
  mutate_at(.vars = vars(c("world_happiness_report_score","gdp_per_capita_ppp")), .funs = as.numeric)

lookup <- read.csv('./data/happiness/Countries-Continents.csv', stringsAsFactors = F)

data <- inner_join(data, lookup, by = c("indicator" = "Country")) %>%
  mutate(Continent = toupper(Continent))
GGPLOT2
p <- ggplot(data = data,
aes(x = gdp_per_capita_ppp, y = world_happiness_report_score,
size = population, colour = Continent)) +
geom_point_interactive(alpha = 0.7, aes(tooltip = indicator)) +
theme_classic() +
theme(
plot.background = element_rect(fill = "#001837", colour = "#001837"),
panel.background = element_rect(fill = "#001837", colour = "#001837"),
plot.title = element_text(,size = 10, colour = "white", hjust = 0.4),
axis.title.x = element_text(size = 5, hjust = 0.18,vjust = 8, face = "bold", colour = "#a8b5c6"),
axis.title.y = element_text(size = 5, hjust = 0.1, vjust = -5, face = "bold",colour = "#a8b5c6"),
axis.text = element_text(size = 5, colour = "#a8b5c6", face = "bold"),
axis.ticks = element_blank(),
axis.line = element_line(colour = "#001837"),
legend.background=element_blank(),
legend.title = element_blank(),
legend.position = c(0.9, 0.1),
legend.text = element_text(colour = "#a8b5c6", face = "bold", size = 5),
legend.key.size = unit(2.5,"mm")) +
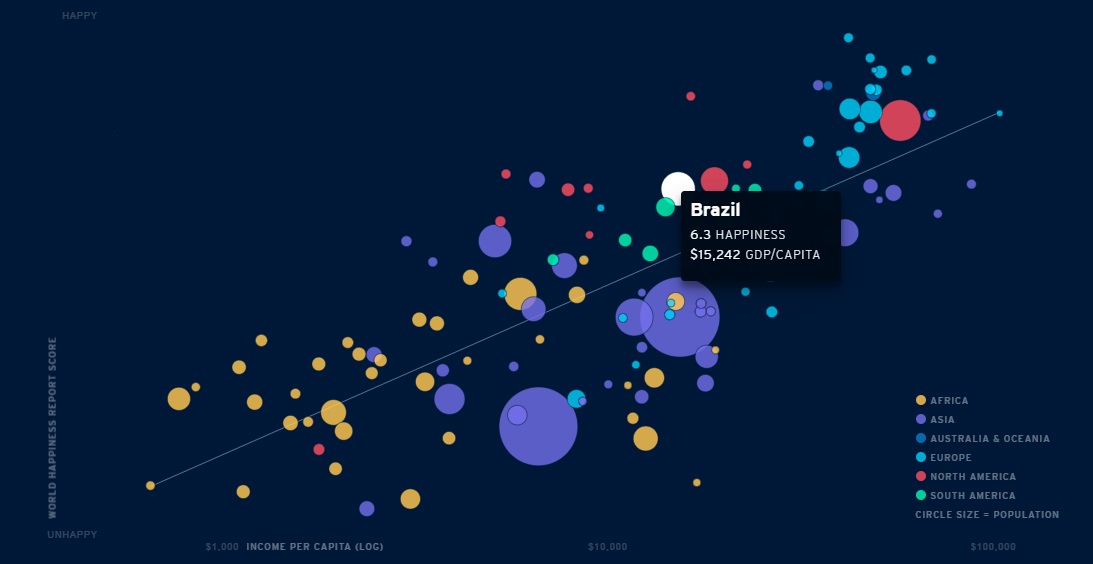
labs(title = "Can money buy happiness?",
x = "INCOME PER CAPITAL (LOG)",
y = "WORLD HAPPINESS REPORT SCORE") +
scale_y_continuous(breaks = c("UNHAPPY" = 2.662 , "HAPPY" = 7.788),) +
scale_size_continuous(range = c(1, 15),guide = FALSE) +
scale_x_log10(breaks = c(1000,10000,100000),labels = scales::dollar) +
scale_color_manual(values = c("AFRICA" = "#d4a94b","ASIA" = "#5c5ec8","AUSTRALIA AND OCEANIA" = "#0567ad","EUROPE" = "#00add4","NORTH AMERICA" = "#d04358","SOUTH AMERICA" = "#00d09f")) +
geom_smooth(method = 'lm',size = 0.25, colour = '#a8b5c6', se = F) +
guides(colour = guide_legend(override.aes = list(size = 1.5)))
girafe(code = print(p))