Original Image
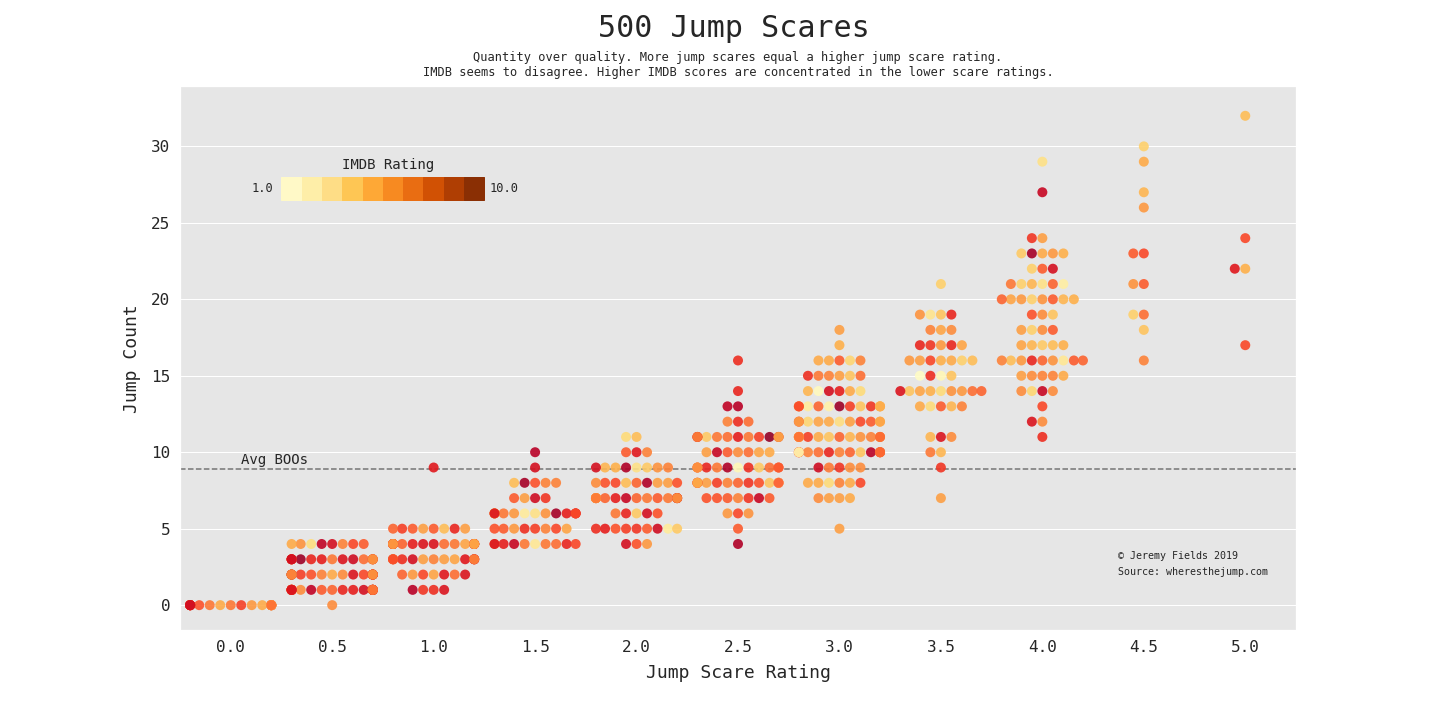
The image below was published on reddit [/r/dataisbeautiful] by user /u/Delafields as a submission for the October month challenge titled “Visualize the Jump-Scares for over 500 horror, thriller, and sci-fi Movies” https://www.reddit.com/r/dataisbeautiful/comments/dei68x/battle_dataviz_battle_for_the_month_of_october/
Data Preparation
Below is the accompanying code to reproduce the chart above. The data was scraped from the website https://wheresthejump.com/full-movie-list/.
library(dplyr)
library(rvest)
library(xml2)
library(ggplot2)
library(ggbeeswarm)
library(janitor)

horror_movie <- xml2::read_html(x = "https://wheresthejump.com/full-movie-list/") %>%
    html_nodes(xpath='//*[@id="tablepress-1"]') %>%
    html_table() %>% .[[1]] %>% clean_names()
GGPLOT2
ggplot(data = horror_movie, aes(x=jump_scare_rating,y=jump_count)) +
  geom_quasirandom(aes(color=imdb), method = "tukeyDense", cex=2) +
  scale_colour_gradientn( # for custom coloring of legend colors via rgb2hex
    colours = c(
      "#FFF9C7","#FEEEA8","#FEDD86","#FEC654","#FEA836",
      "#F78A21","#E96D12", "#D15104","#AF3E03","#8A2F04"
    ),
    aesthetics = c("colour","fill"),
    breaks = 1:10, labels=c("1.0",rep("",8),"10.0"),
    limits=c(1,10),
    guide = guide_colorbar(
      title = "IMDB Rating",
      title.position = "top",
      title.hjust = 0.5,    # centering legend title
      ticks = FALSE,
      draw.llim = FALSE,
      draw.ulim = FALSE,
      raster = FALSE, # for rendering as set of rectangles
      frame.colour = NULL
    )
  ) +
  scale_y_continuous(breaks = seq(from = 0,to = 35, by = 5)) +
  scale_x_continuous(breaks = seq(from = 0,to = 5, by = 0.5)) +
  # scale_x_continuous(breaks = seq(from = 0,to = 5, by = 0.5)) +
  theme_classic() +
  theme(
      panel.grid.minor.x = element_blank(),
      panel.grid.minor.y = element_blank(),
      panel.grid.major.y = element_line(color = "white"),
      plot.title = element_text(hjust=0.5,face="bold", size = 25, family = ""),
      plot.subtitle = element_text(hjust = 0.5), # centering subtitle
      panel.background   = element_rect(fill = "#E6E6E6"),
      legend.position = c(.20, .825),            # custom legend position
      legend.direction="horizontal",
      legend.background = element_rect(fill="#E6E6E6"),
      legend.key.width  = unit(1, "cm"),         # width of legend
      legend.key.height = unit(0.4, "cm")        # height of legend
  ) +
  xlab("Jump Scare Rating") + ylab("Jump Count") +
  labs(
      title = "500 Jump Scares",
      subtitle = "Quantity over Quality. More jump scares equal a higher jump scare rating.\nIMDB seems to disagree. Higher IMDB scores are concentrated in the lower scare ratings."
  ) +
  annotate(geom = "text", x = 4.4, y = 4, label = "symbol('\343')~Jeremy~Fields~2019",
           parse=TRUE, hjust = 0, size = 3) +    # placing caption for source attribution
  annotate(geom = "text", x = 4.4, y = 3, label = "Source: wheresthejump.com",
           parse=FALSE, hjust = 0, size = 3)