Original Image
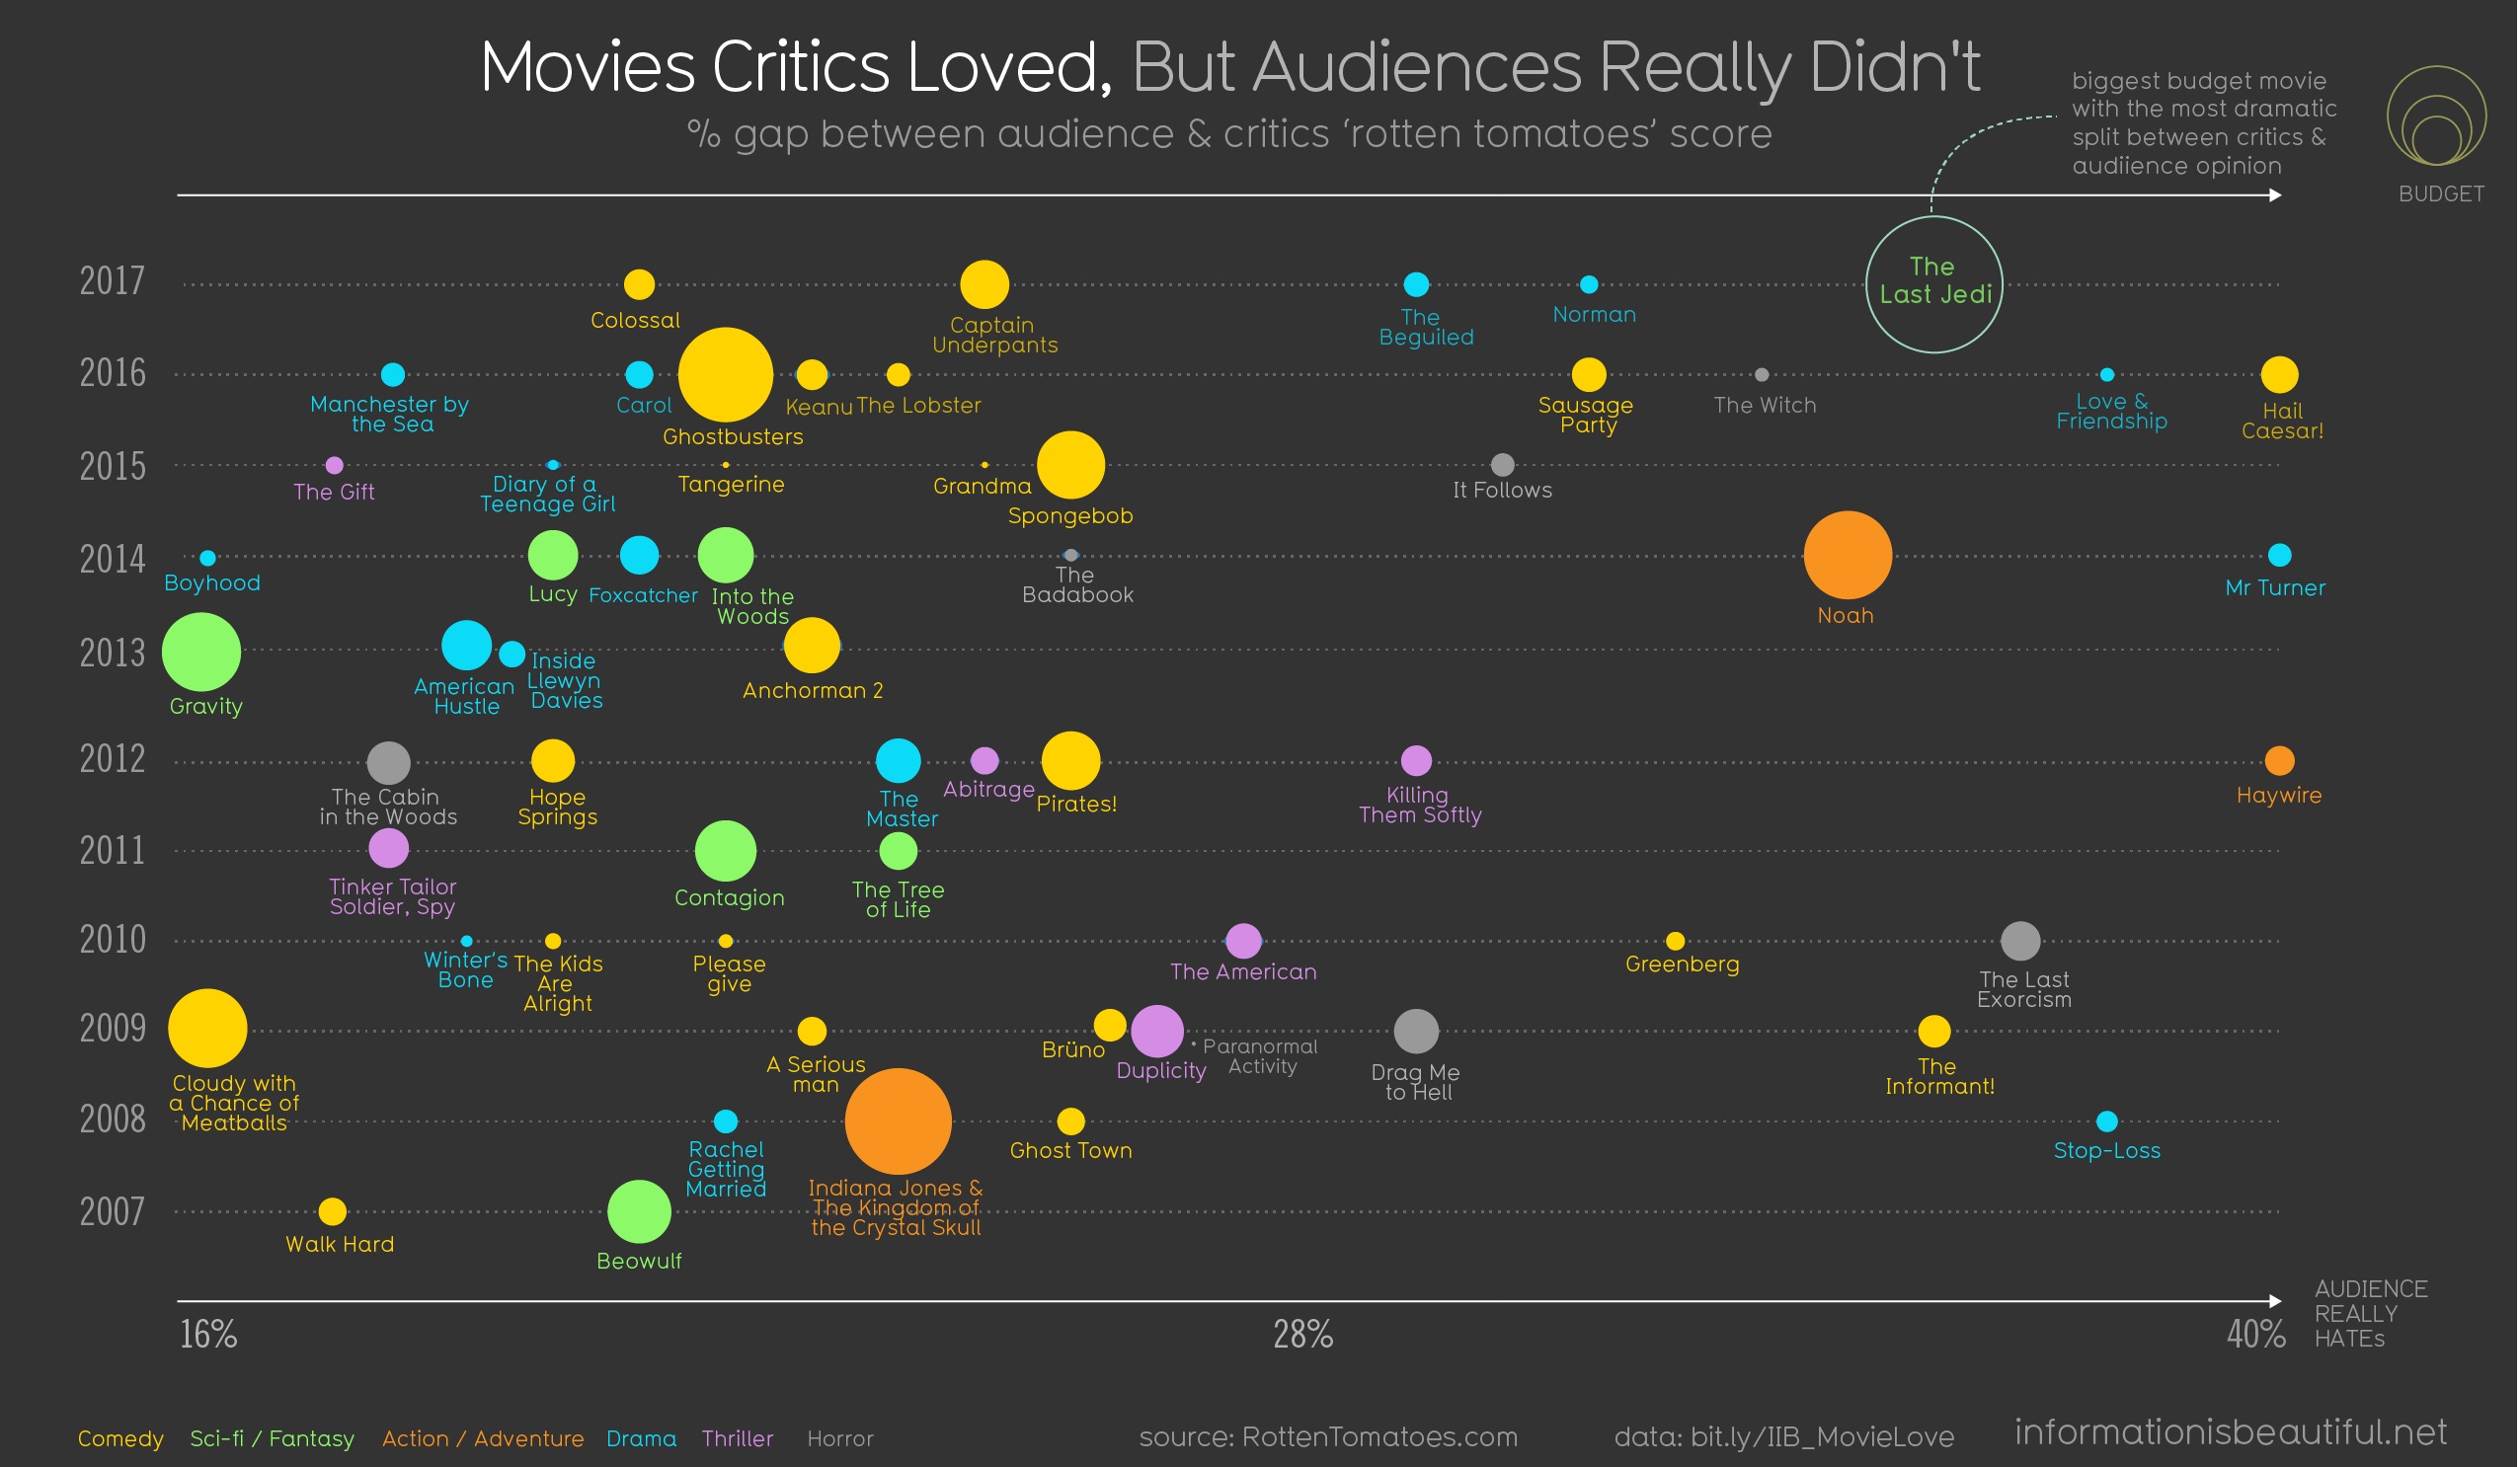
The image below was featured in Information is Beatiful. https://informationisbeautiful.net/visualizations/star-wars-last-jedi-one-of-the-biggest-rotten-tomatoes-audience-vs-critics-score-splits-ever/
Data Preparation
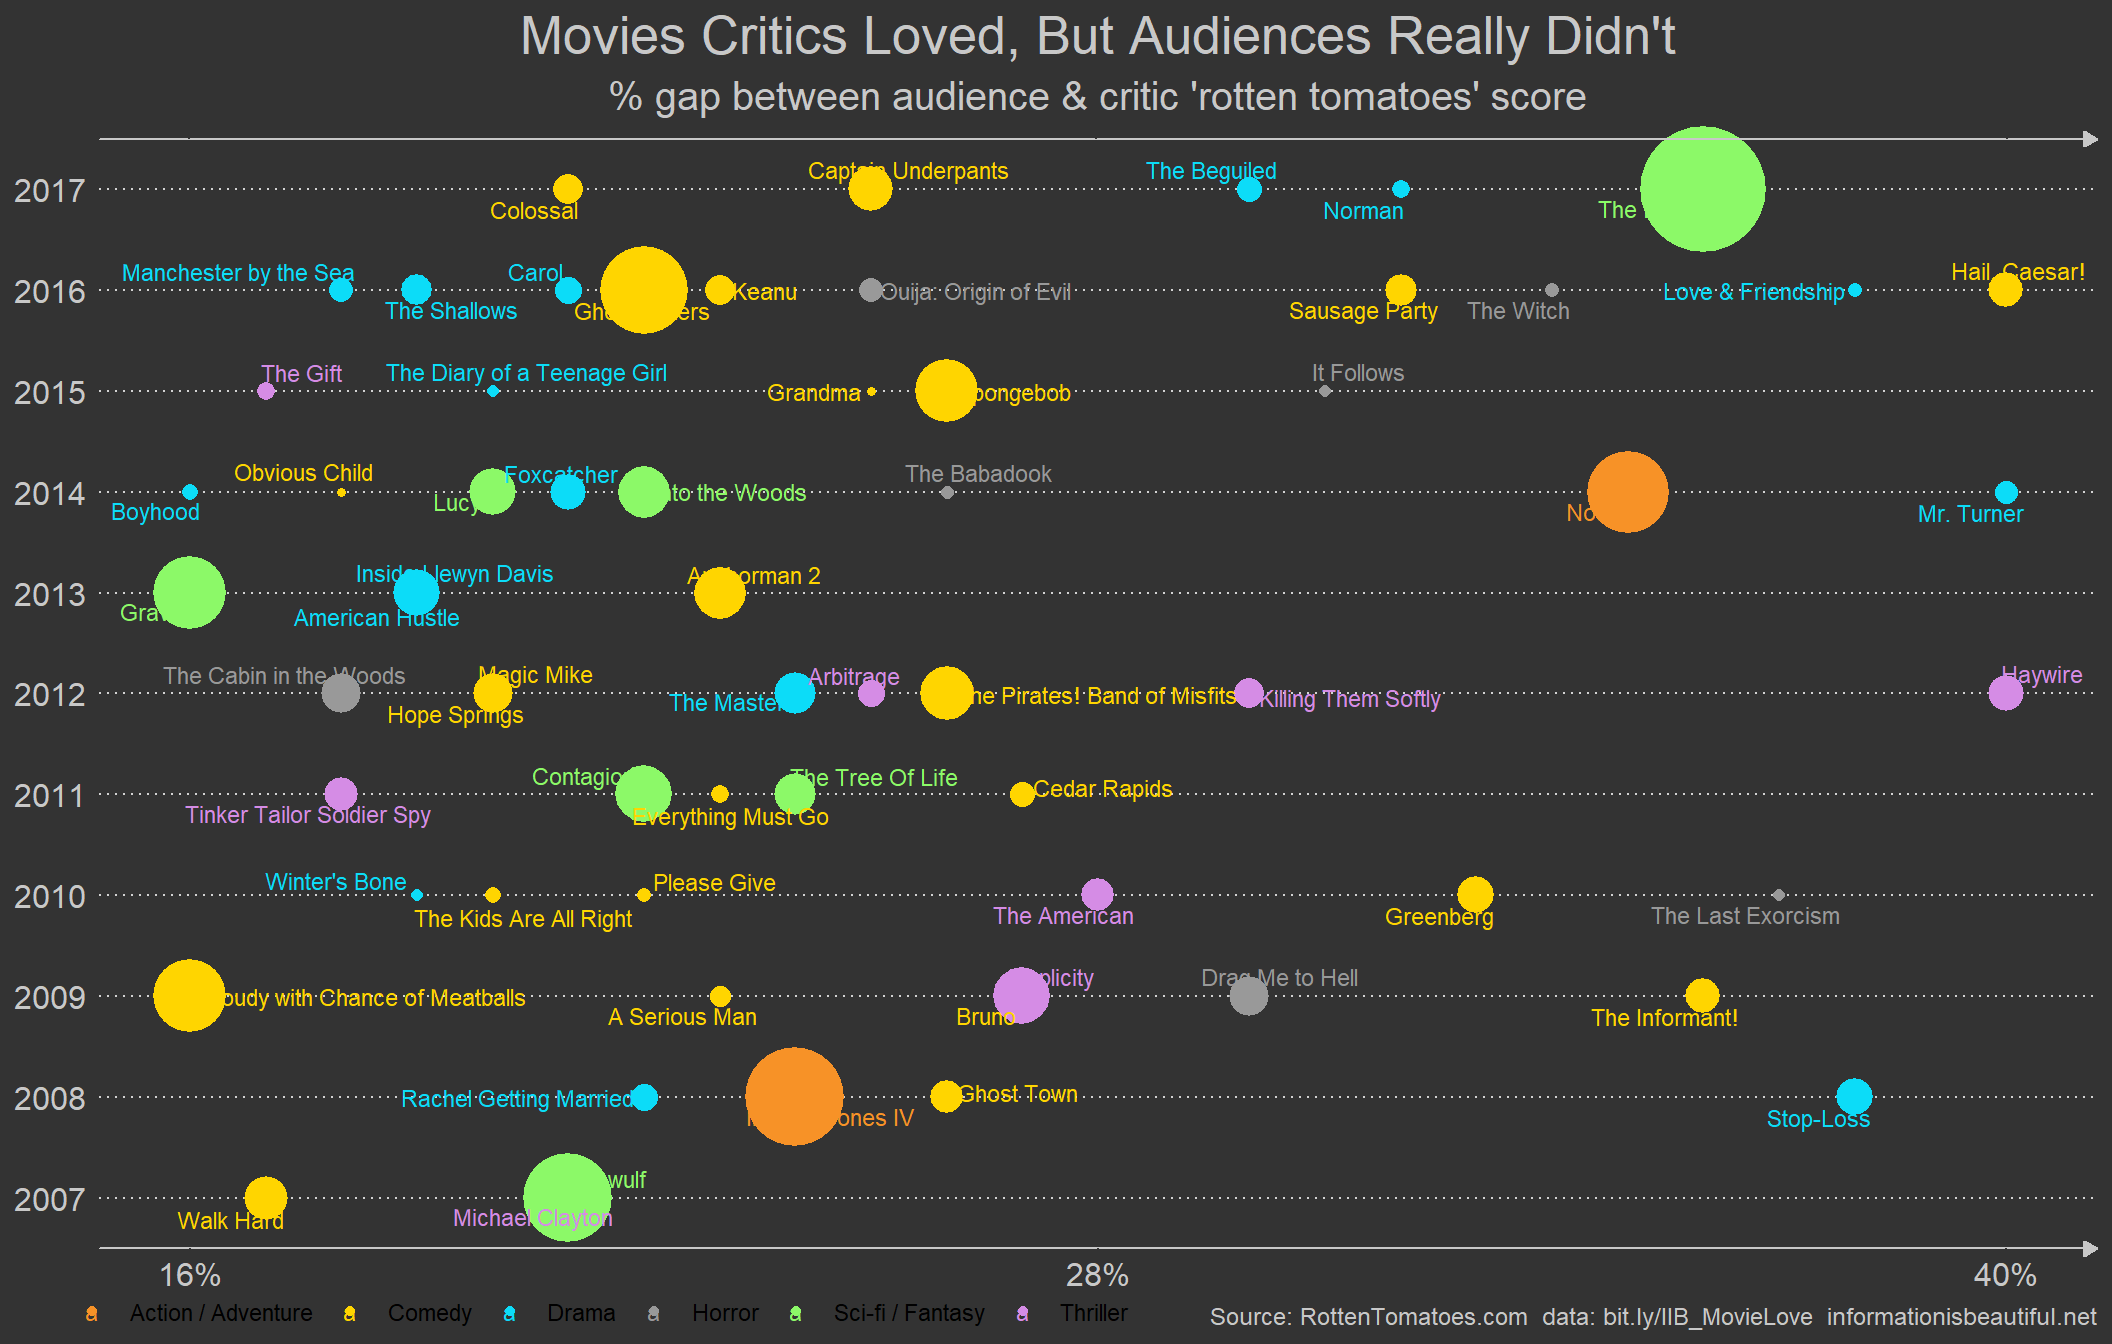
Below is the accompanying code to reproduce the chart above. The data was sourced from data export options in the link above.
library(ggplot2)
library(ggrepel)
library(dplyr)

data <- read.csv('./data/movies.csv', stringsAsFactors = F) %>%
  janitor::clean_names() %>%
  filter(x_gap >= 15, genre %in% c("Sci-fi / Fantasy","Thriller","horror","Horror","drama","Drama","comedy","Comedy","Action / Adventure")) %>%
  mutate(year = year, budget_million = as.numeric(budget_million),
         radius = sqrt(budget_million/pi)) %>%
  filter(budget_million!=0)
GGPLOT2
ggplot(data, aes(x = x_gap, y = year, size = budget_million)) +
  geom_point(aes(colour = genre),shape=16, alpha = 1)  +
  scale_size_area(max_size = 22, guide = FALSE) +
  geom_text_repel(aes(y = year, label = film, colour = genre), size = 3, segment.color = NA) +
  #geom_text_repel(aes(y = year - (radius/max(data$radius)), label = film, colour = genre), size = 3, segment.color = NA) +
  theme(plot.background = element_rect(fill = "#333333", colour = "#333333"),
        panel.background = element_rect(fill = "#333333", colour = "#333333"),
        panel.grid.major.x = element_blank(),
        panel.grid.minor.x = element_blank(),
        panel.grid.major.y = element_line(linetype = 3, colour = "lightgrey"),
        panel.grid.minor.y = element_blank(),
        plot.title = element_text(size = 20, colour = "#c8c8c8", hjust = 0.5),
        plot.subtitle = element_text(size = 15, colour = "#c8c8c8", hjust = 0.5),
        axis.text = element_text(size = 12, colour = "#c8c8c8"),
        axis.line.x.bottom = element_line(arrow = arrow(length = unit(0.2,"cm"), type = "closed"), colour = "#c8c8c8", size = 0.5),
        axis.line.x.top = element_line(arrow = arrow(length = unit(0.2,"cm"), type = "closed"), colour = "#c8c8c8", size = 0.5),
        legend.position = c(0.25,-0.05),
        legend.background=element_blank(),
        legend.key = element_blank(),
        legend.title = element_blank(),
        plot.caption = element_text(size = 9, colour = "#c8c8c8")
        ) +
  scale_y_continuous(breaks = seq(2007,2017)) +
  scale_x_continuous(breaks = c(16,28,40),labels = c("16%","28%","40%"), sec.axis = dup_axis(labels = NULL)) +
  scale_colour_manual(values = c("Comedy" = "#ffd500", "Sci-fi / Fantasy" = "#8cf968", "Action / Adventure" = "#f79227", "Drama" = "#0cdcf8", "Drama" = "#d58ce5","Thriller" = "#d58ce5", "Horror" = "#999999"), guide = guide_legend(nrow = 1)) +
  labs(title = "Movies Critics Loved, But Audiences Really Didn't",
       subtitle = "% gap between audience & critic 'rotten tomatoes' score",
       y = NULL, x = NULL,
       caption = "Source: RottenTomatoes.com  data: bit.ly/IIB_MovieLove  informationisbeautiful.net") +
  coord_cartesian(clip = "off")