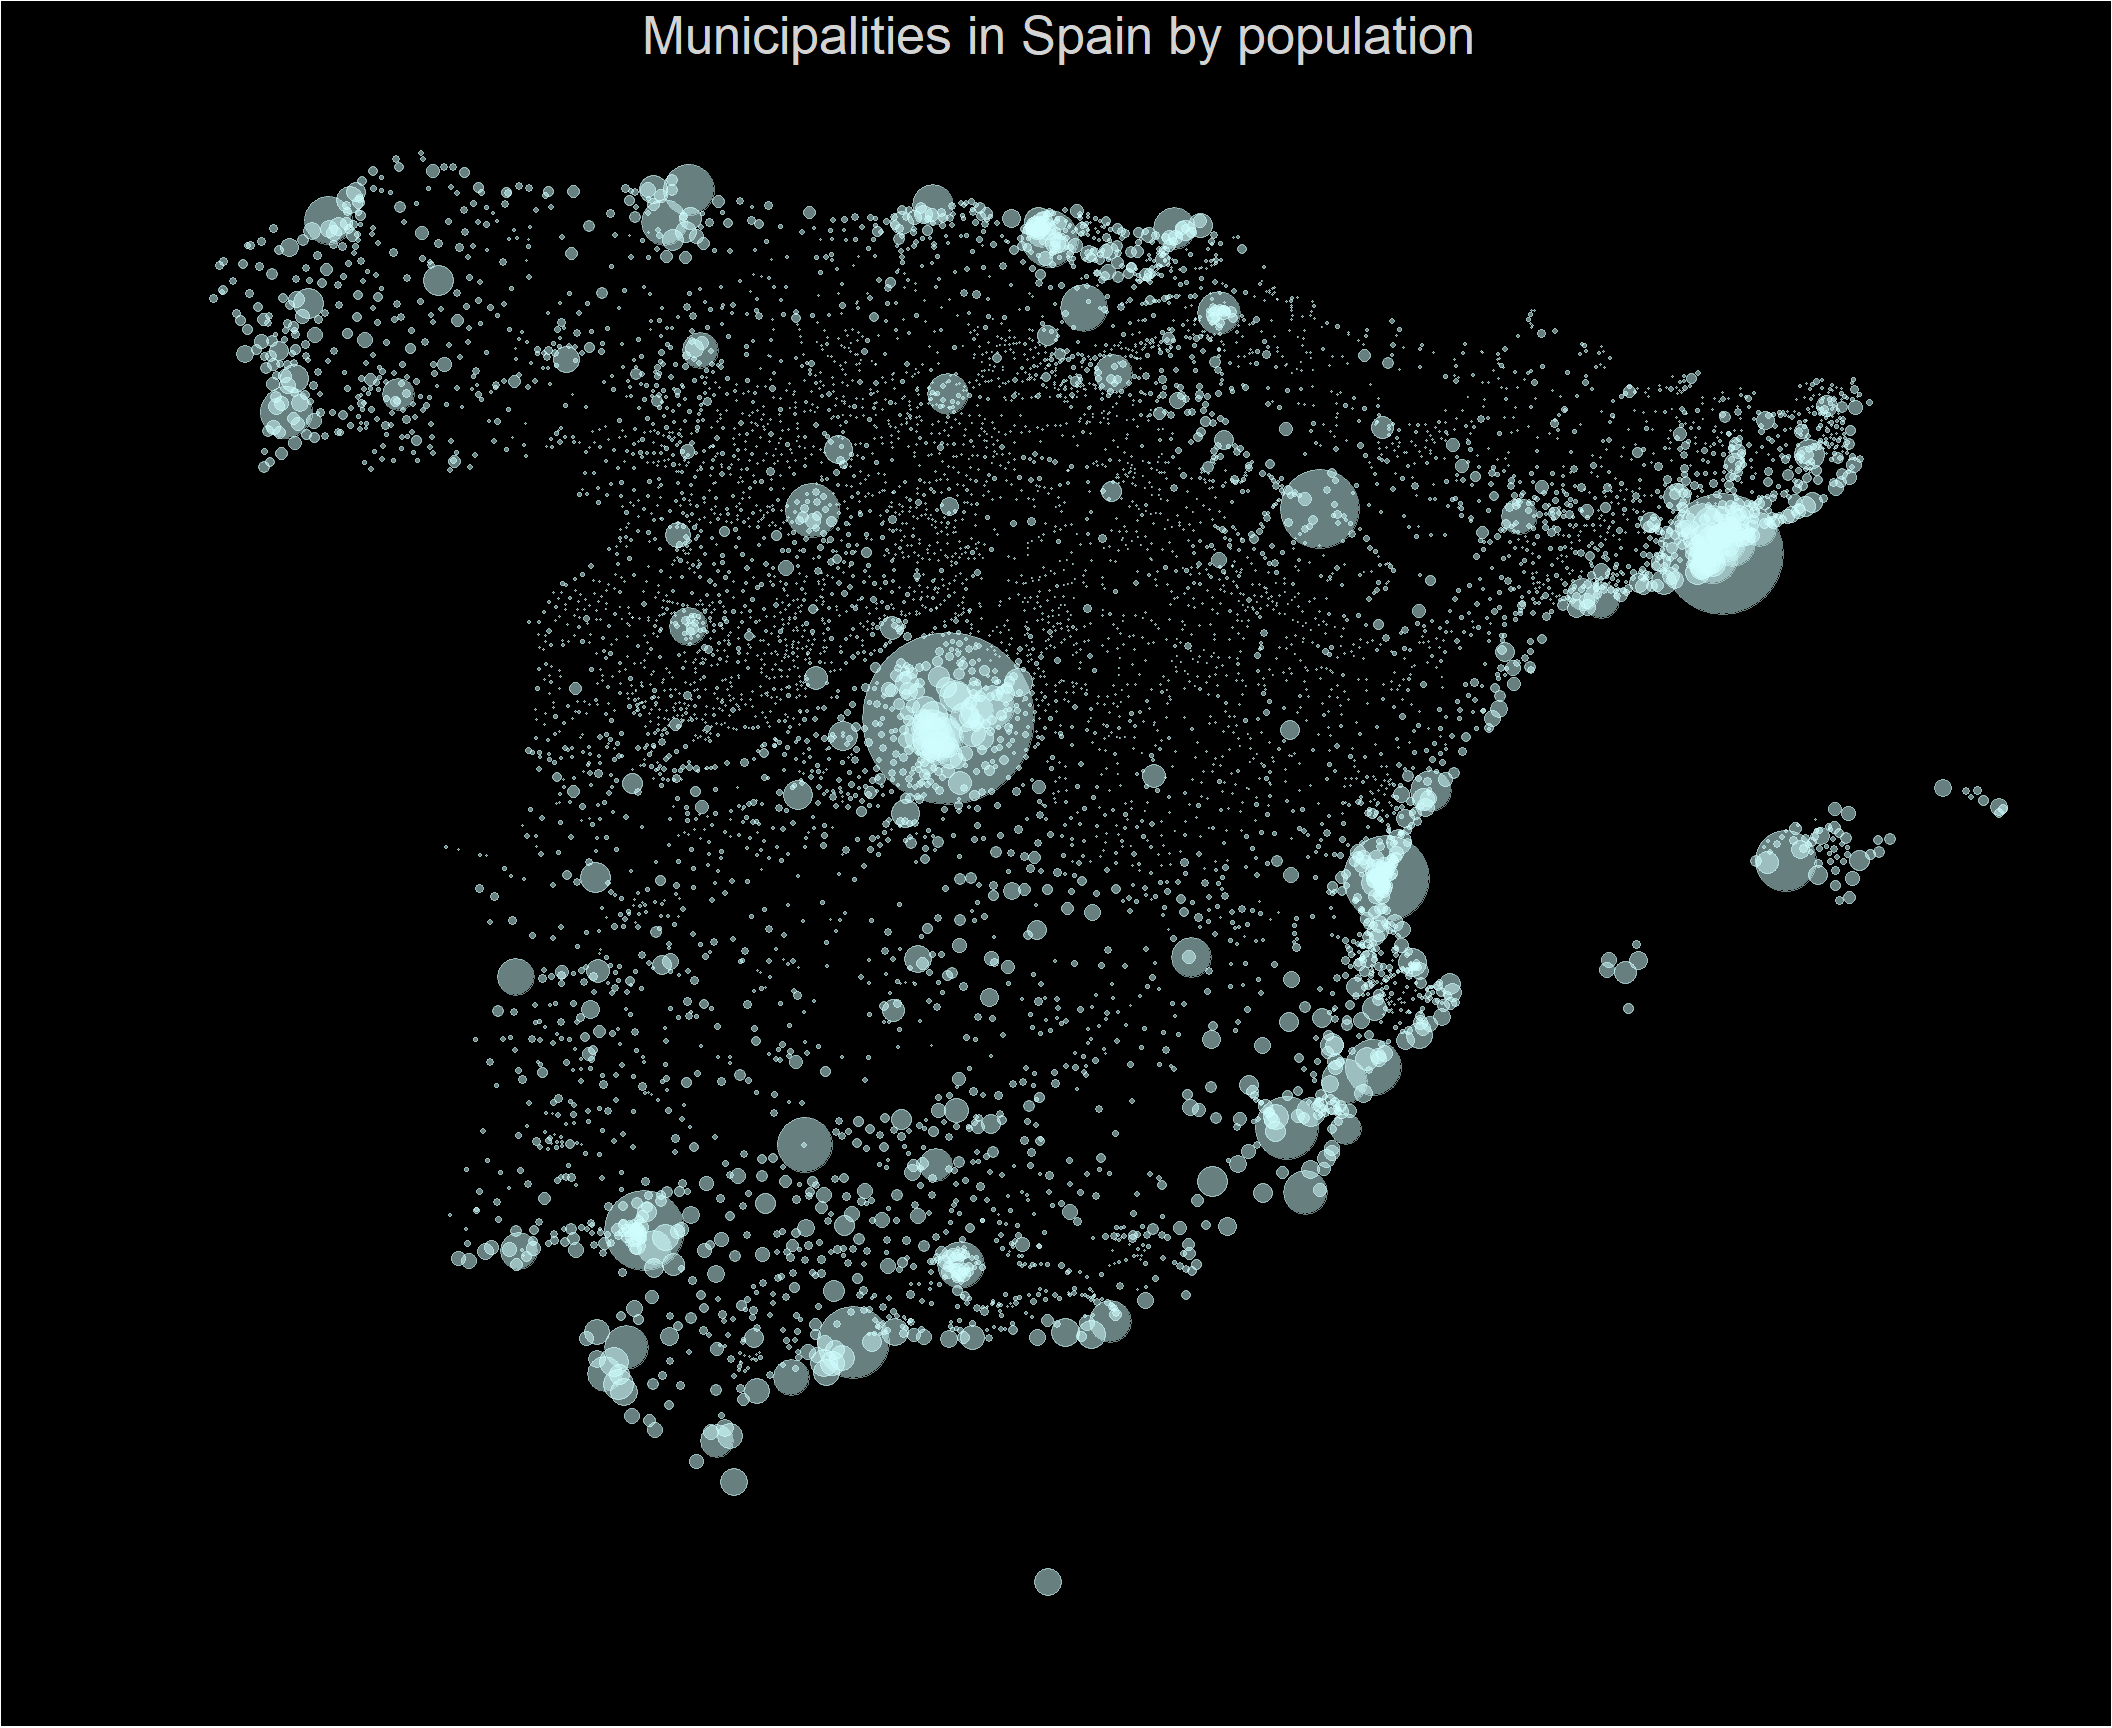
Original Image
The image below was published on reddit [/r/dataisbeautiful] by user /u/amunozo1. https://www.reddit.com/r/dataisbeautiful/comments/dswb9k/oc_municipalities_in_spain_by_population/
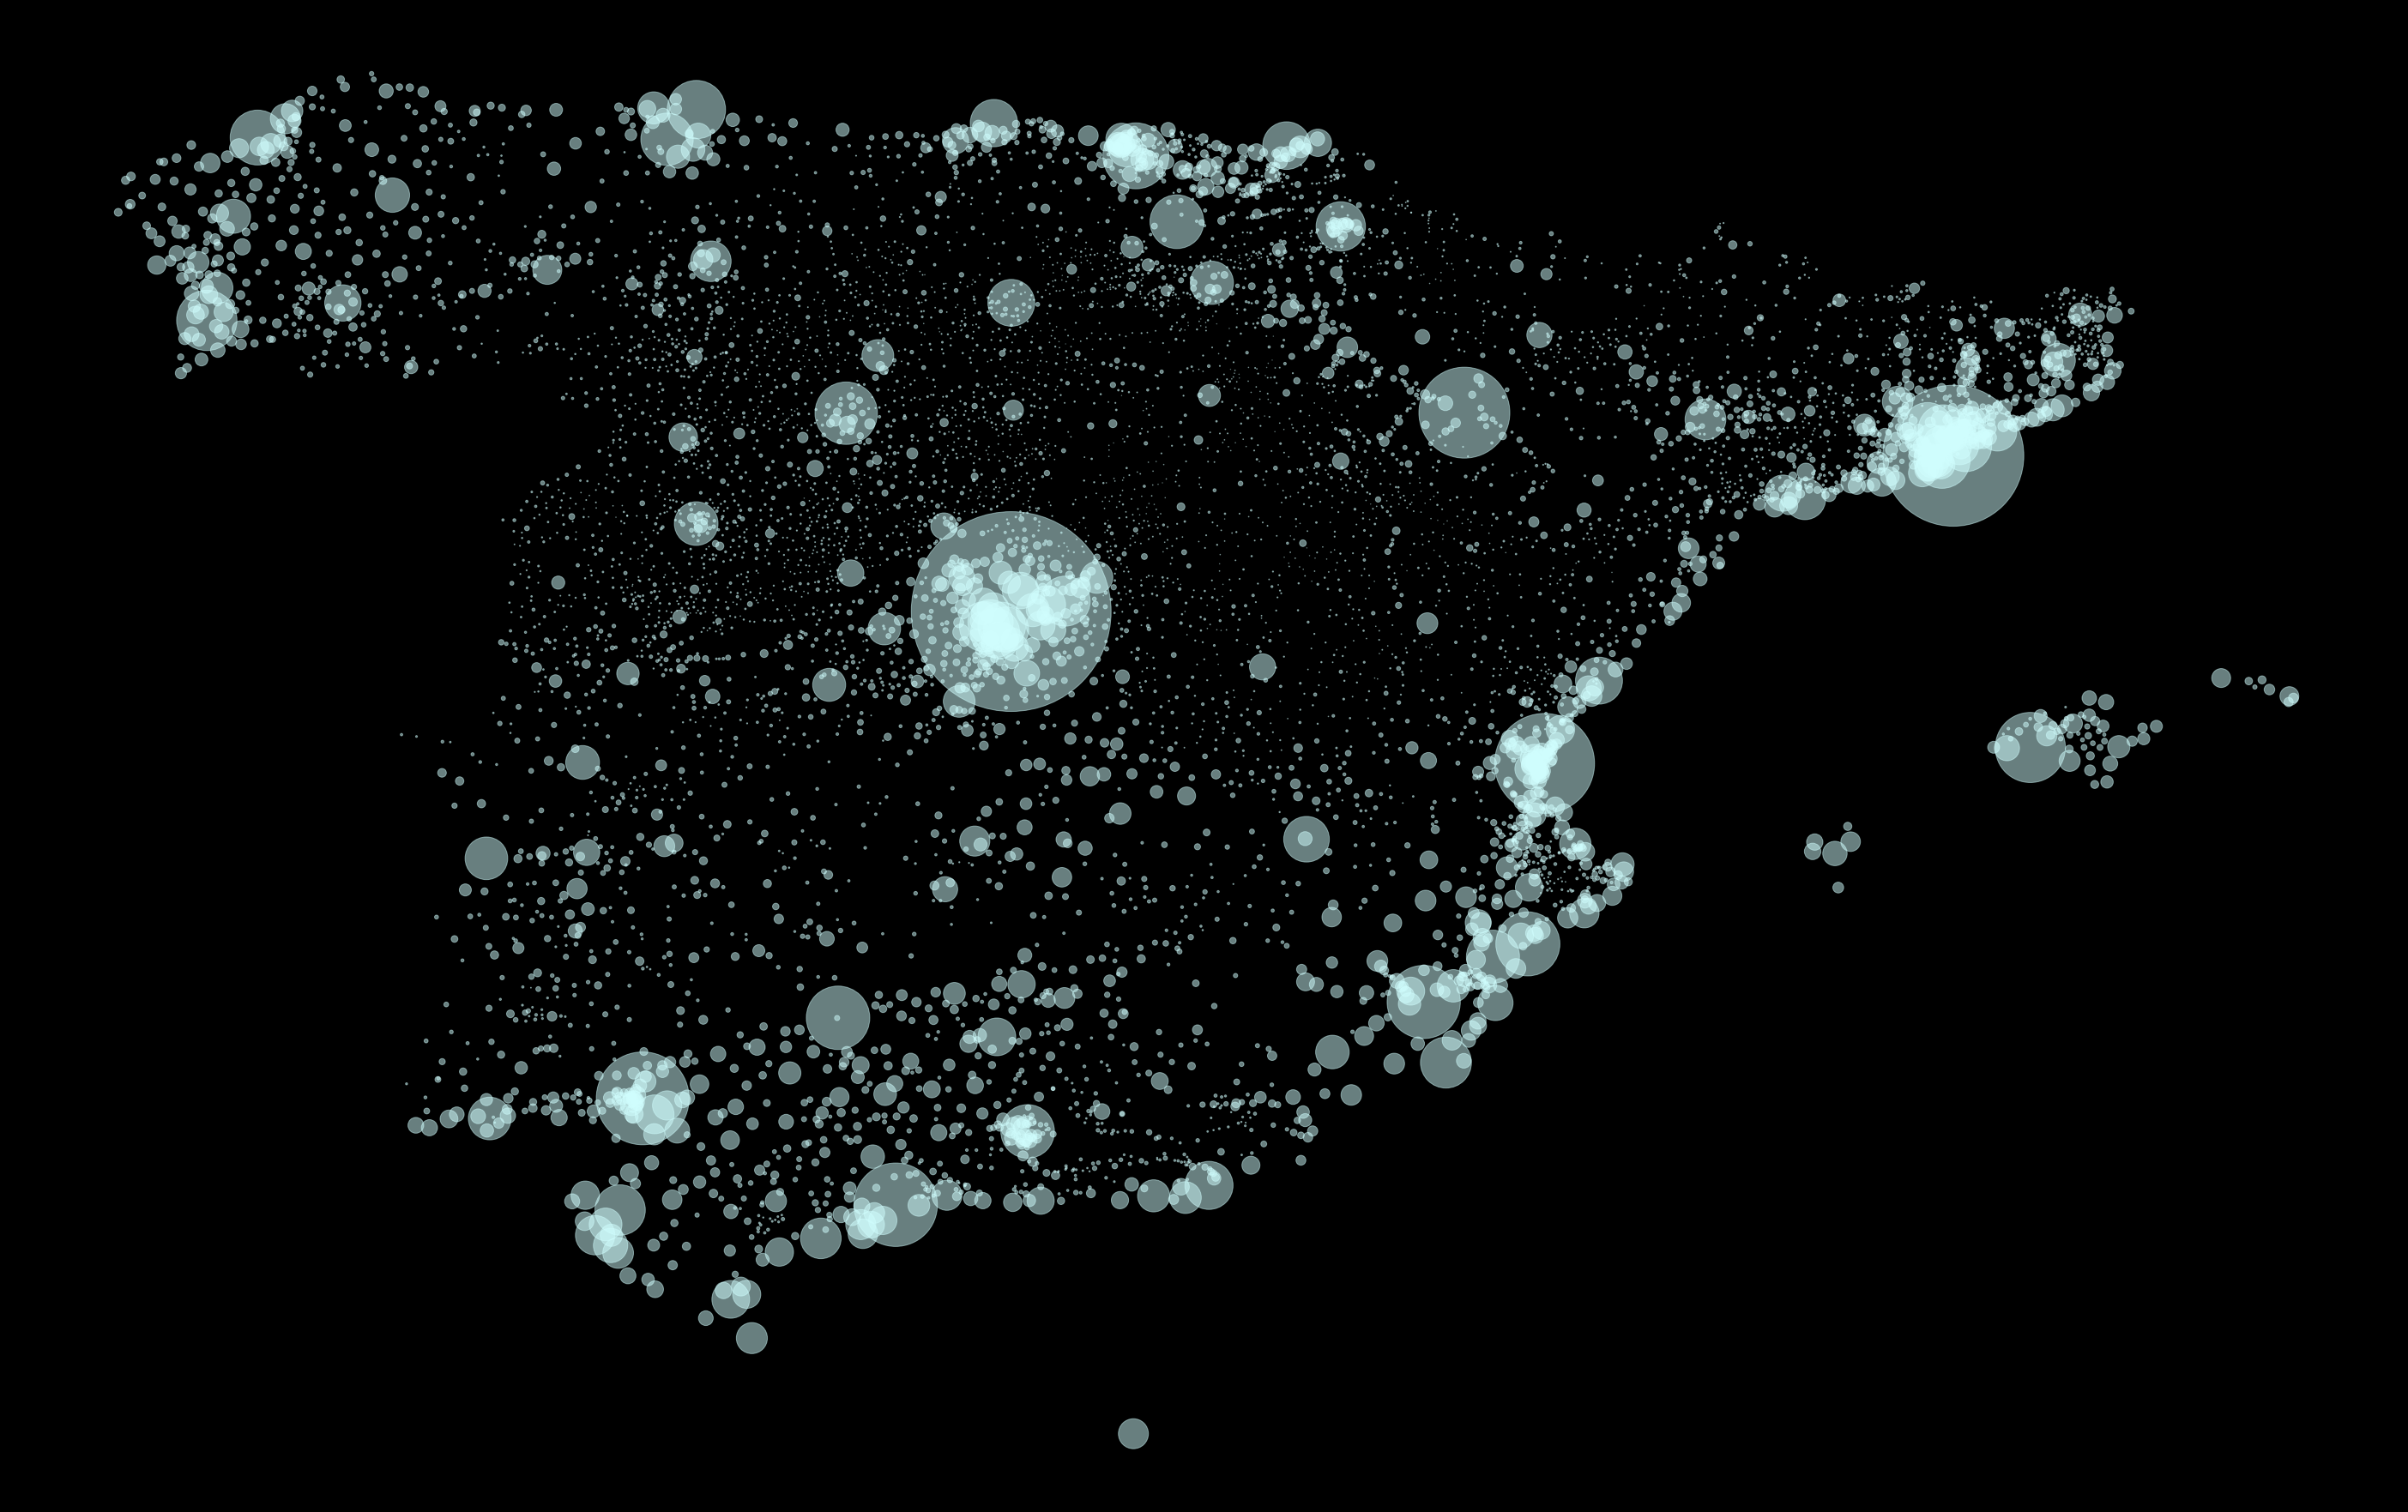
Data Preparation
Below is the accompanying code to reproduce the chart above. The data was shared by the user at their github repository. https://github.com/amunozo/population-by-municipalities.
library(dplyr)
library(readxl)
library(ggplot2)
library(janitor)

spain_pop <- readxl::read_xls(
  path = "./data/listado-longitud-latitud-municipios-espana.xls",
  skip = 2
) %>% clean_names()
GGPLOT2
ggplot(data = spain_pop, aes(x=longitud,y=latitud,size=habitantes)) +
  geom_point(colour = "#cffdfd", alpha = 0.5, shape = 19) +
  scale_size_area(max_size = 30) +
  theme_classic() +
  theme(
    panel.grid.minor = element_blank(),
    panel.grid.major = element_blank(),
    plot.title       = element_text(color = "lightgrey", hjust = 0.5, size = 20),
    panel.background = element_rect(fill = "#000000"),
    plot.background  = element_rect(fill = "#000000"),
    legend.position  = "none",
    axis.ticks       = element_blank(),
    axis.text        = element_blank(),
    axis.line        = element_blank()
  ) +
  labs(title = "Municipalities in Spain by population", x= NULL, y = NULL) +
  xlim(c(-10,max(spain_pop$longitud))) +
  ylim(c(35,max(spain_pop$latitud)))