Original Image
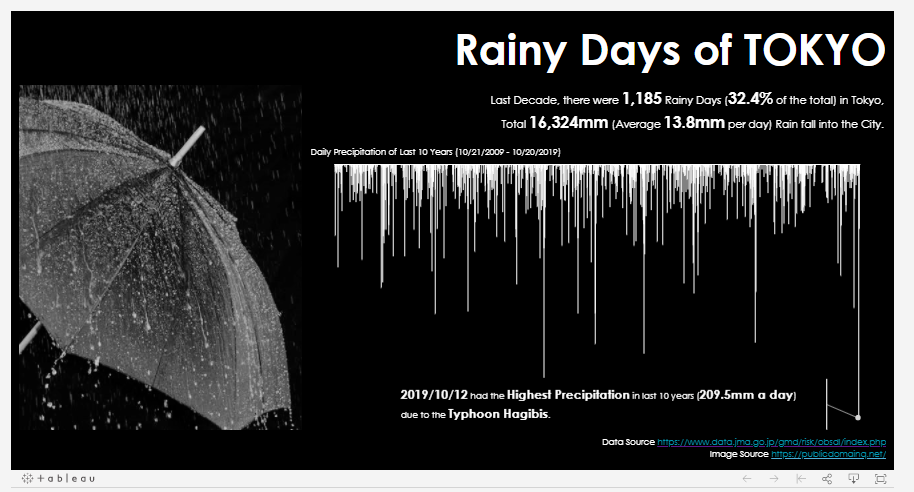
The image below was featured in Tableau Public Gallery. https://public.tableau.com/en-us/gallery/rainy-days-tokyo?tab=viz-of-the-day&type=viz-of-the-day
Data Preparation
Below is the accompanying code to reproduce the chart above. The data is extracted from the data download tool in Tableau website.
library(ggplot2)
library(dplyr)
library(grid)
library(cowplot)

data <- read.csv(file = './data/tokyo_rainfall.csv', stringsAsFactors = F) %>%
    janitor::clean_names()

colnames(data) <- c("date","first_day", "last_day", "rainfall")

data <- data %>% mutate(date = as.Date(date, format = "%Y/%m/%d"), rainfall = -1*rainfall)
GGPLOT2
p1 <- ggplot(data) +
geom_bar(aes(x = date, y = rainfall), colour = "white", stat='identity') +
annotate(geom = "point", x = as.Date("2019-10-12"), y = min(data$rainfall), colour = "white", size = 3) +
annotate(geom = "text", x = as.Date("2015-06-12"), y = min(data$rainfall) + 5, colour = "white", size = 3, label = "2019/10/12 has the Highest Precipitation in the last 10 years (209.5 mm a day)\ndue to the Typhoon Hagibis") +
annotate(geom = "segment", x = as.Date("2019-05-12"), xend = as.Date("2019-05-12"), y = min(data$rainfall) - 10, yend = min(data$rainfall) + 20,
colour = "white" ) +
annotate(geom = "segment", x = as.Date("2019-10-12"), xend = as.Date("2019-05-12"), y = min(data$rainfall) , yend = min(data$rainfall) + 5,
colour = "white" ) +
theme(panel.background = element_rect(fill = "black"),
plot.background = element_rect(fill = "black", colour = NA),
plot.title = element_text(hjust = 1, size = 40, colour = "white"),
plot.subtitle = element_text(hjust = 1, size = 12, colour = "white"),
plot.caption = element_text(colour = "white"),
panel.grid.major = element_blank(),
panel.grid.minor = element_blank(),
axis.text = element_blank()
) +
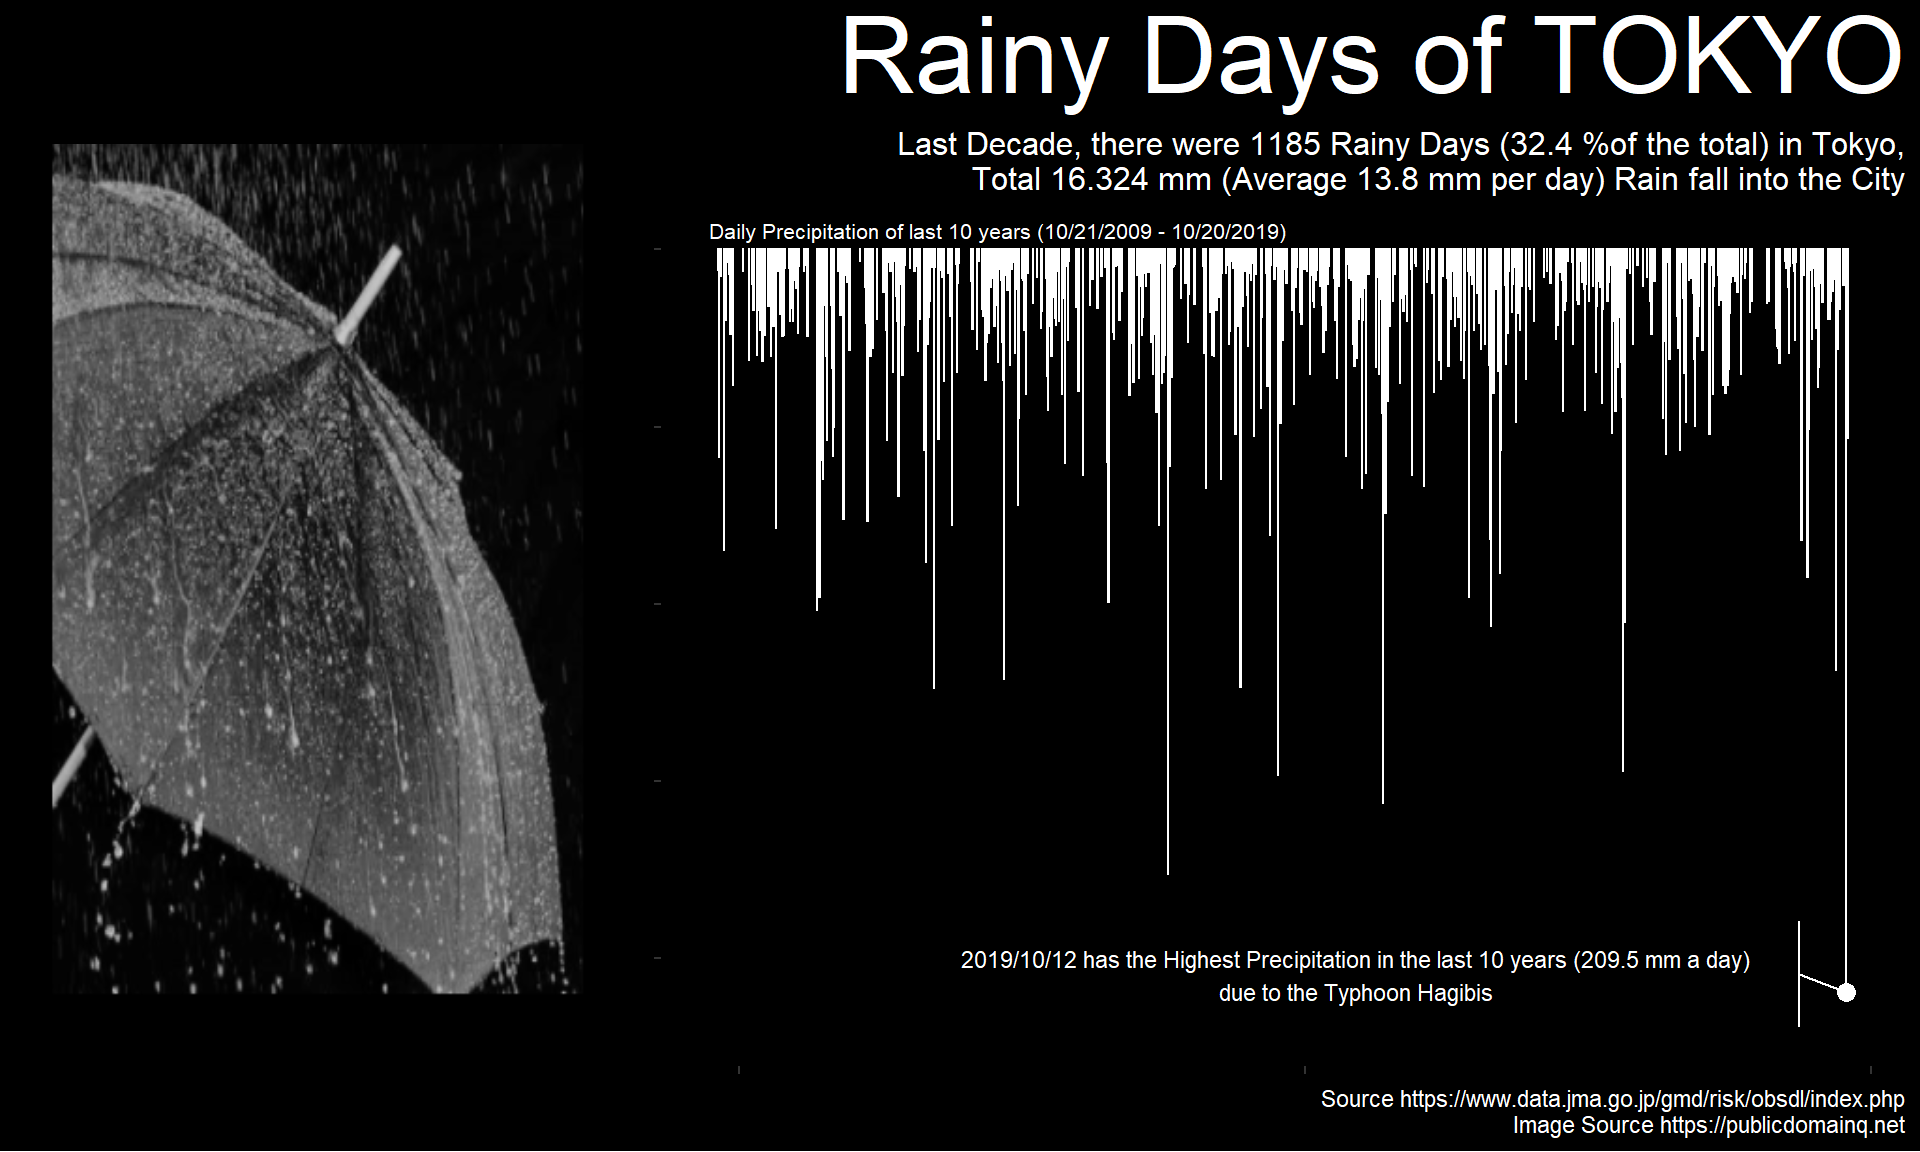
labs(title = "Rainy Days of TOKYO",
subtitle = "Last Decade, there were 1185 Rainy Days (32.4 %of the total) in Tokyo,\n Total 16.324 mm (Average 13.8 mm per day) Rain fall into the City",
caption = "Source https://www.data.jma.go.jp/gmd/risk/obsdl/index.php\nImage Source https://publicdomainq.net",
x = NULL, y = NULL)
p2 <- rasterGrob(png::readPNG('./data/umbrella.png'), width = unit(0.85,"npc"), height = unit(0.75,"npc"))
p3 <- plot_grid(p2, p1, ncol = 2, rel_widths = c(1,2)) +
theme(plot.background = element_rect(fill = "black", colour = NA))
print(p3)
grid.text(label = "Daily Precipitation of last 10 years (10/21/2009 - 10/20/2019)",
x = 0.52, y = 0.8, gp=gpar(fontsize=8, col="white"))